Multiple Choice
Exhibit 16.2.Typically,the sales volume declines with an increase of a product price.It has been observed,however,that for some luxury goods the sales volume may increase when the price increases.The following Excel output illustrates this rather unusual relationship. 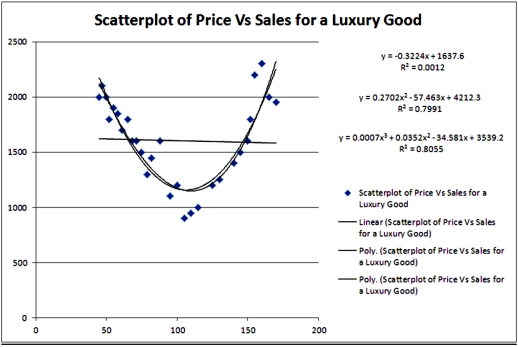 Refer to Exhibit 16.2.For the considered range of the price,the relationship between Price and Sales should be described by a:
A) concave function.
B) hyperbola.
C) convex function.
D) linear function.
Correct Answer:

Verified
Correct Answer:
Verified
Q59: Exhibit 16-1.The following Excel scatterplot with the
Q60: For the quadratic regression equation <img src="https://d2lvgg3v3hfg70.cloudfront.net/TB2339/.jpg"
Q62: Exhibit 16-7.It is believed that the sales
Q63: Exhibit 16-4.The following data shows the cooling
Q65: Exhibit 16-7.It is believed that the sales
Q66: Exhibit 16.5.The following data shows the demand
Q67: Exhibit 16.5.The following data shows the demand
Q68: Exhibit 16-7.It is believed that the sales
Q69: Exhibit 16-7.It is believed that the sales
Q85: The coefficient of determination R<sup>2</sup> cannot be