Multiple Choice
Exhibit 16-1.The following Excel scatterplot with the fitted quadratic regression equation illustrates the observed relationship between productivity and the number of hired workers. 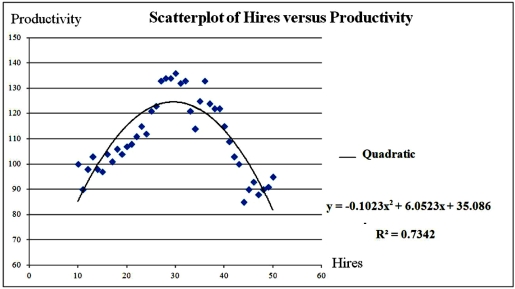 Refer to Exhibit 16.1.Assuming that the values of Hires can be non-integers,what is the maximum value of Productivity?
A) 29.58
B) 124.603
C) 35.086
D) 127.50
Correct Answer:

Verified
Correct Answer:
Verified
Q26: When the predicted value of the response
Q27: The quadratic and logarithmic models,y = β<sub>0</sub>
Q28: Exhibit 16.2.Typically,the sales volume declines with an
Q29: Exhibit 16.5.The following data shows the demand
Q30: Which of the following is a quadratic
Q32: For which of the following models,the formula
Q33: If the data is available on the
Q34: Exhibit 16-7.It is believed that the sales
Q35: An inverted U-shaped curve is also known
Q58: Although a polynomial regression model of order