Multiple Choice
Exhibit 16.2.Typically,the sales volume declines with an increase of a product price.It has been observed,however,that for some luxury goods the sales volume may increase when the price increases.The following Excel output illustrates this rather unusual relationship. 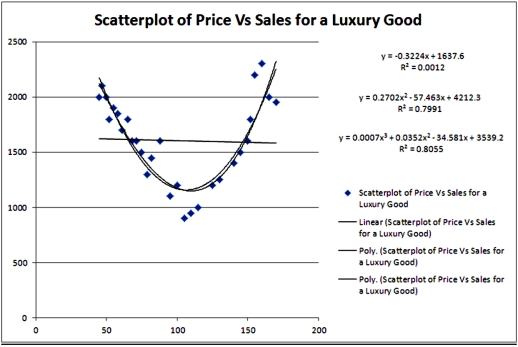 Refer to Exhibit 16.2.What is the number of estimated coefficients of the cubic regression model?
A) 1
B) 2
C) 3
D) 4
Correct Answer:

Verified
Correct Answer:
Verified
Q23: What is the effect of b<sub>2</sub> <
Q24: Exhibit 16.6.Thirty employed single individuals were randomly
Q26: When the predicted value of the response
Q27: The quadratic and logarithmic models,y = β<sub>0</sub>
Q29: Exhibit 16.5.The following data shows the demand
Q30: Which of the following is a quadratic
Q31: Exhibit 16-1.The following Excel scatterplot with the
Q32: For which of the following models,the formula
Q33: If the data is available on the
Q88: A model in which both the response