Multiple Choice
Exhibit 16.2.Typically,the sales volume declines with an increase of a product price.It has been observed,however,that for some luxury goods the sales volume may increase when the price increases.The following Excel output illustrates this rather unusual relationship. 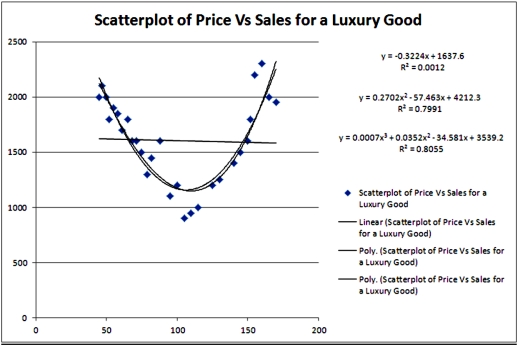 Refer to Exhibit 16.2.Using the cubic regression equation,predict the sales if the luxury good is priced at $100.
A) 1171.85
B) 1133.10
C) 1106.61
D) 1092.91
Correct Answer:

Verified
Correct Answer:
Verified
Q15: Exhibit 16-1.The following Excel scatterplot with the
Q16: Exhibit 16-1.The following Excel scatterplot with the
Q17: Exhibit 16-1.The following Excel scatterplot with the
Q18: Exhibit 16-7.It is believed that the sales
Q19: Exhibit 16.6.Thirty employed single individuals were randomly
Q21: Exhibit 16.6.Thirty employed single individuals were randomly
Q23: What is the effect of b<sub>2</sub> <
Q24: Exhibit 16.6.Thirty employed single individuals were randomly
Q64: The regression model ln(y)= β<sub>0</sub> + β<sub>1
Q88: A model in which both the response