Multiple Choice
Exhibit 16-1.The following Excel scatterplot with the fitted quadratic regression equation illustrates the observed relationship between productivity and the number of hired workers. 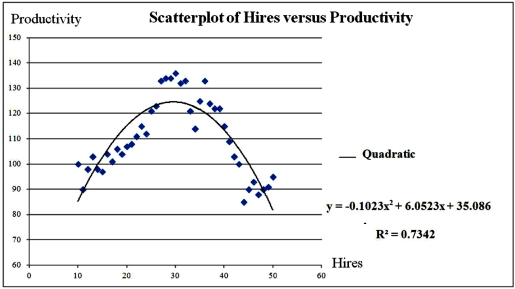 Refer to Exhibit 16.1.Assuming that the number of hired workers must be integer,what is the maximum productivity to achieve?
A) 29.58
B) 30.00
C) 124.603
D) 124.585
Correct Answer:

Verified
Correct Answer:
Verified
Q11: Exhibit 16.5.The following data shows the demand
Q13: Exhibit 16-7.It is believed that the sales
Q15: Exhibit 16-1.The following Excel scatterplot with the
Q17: Exhibit 16-1.The following Excel scatterplot with the
Q18: Exhibit 16-7.It is believed that the sales
Q19: Exhibit 16.6.Thirty employed single individuals were randomly
Q20: The equation y = β<sub>0</sub> + β<sub>1</sub>x
Q20: Exhibit 16.2.Typically,the sales volume declines with an
Q21: Exhibit 16.6.Thirty employed single individuals were randomly
Q72: A model in which the response variable