Multiple Choice
Exhibit 16-4.The following data shows the cooling temperatures of a freshly brewed cup of coffee after it is poured from the brewing pot into a serving cup.The brewing pot temperature is approximately 180º F;see http://mathbits.com/mathbits/tisection/statistics2/exponential.htm 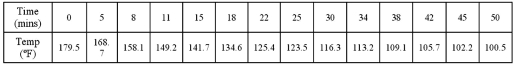 For the assumed exponential model ln(Temp) = β0 + β1Time + ε,the following Excel regression partial output is available.
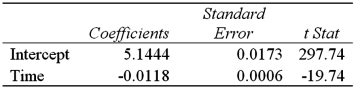 Refer to Exhibit 16-4.What is the percentage of variations in ln(Temp) explained by Time?
A) 45.48%
B) 97.01%
C) 1.40%
D) 46.88%
Correct Answer:

Verified
Correct Answer:
Verified
Q3: For the logarithmic model y = β<sub>0</sub>
Q5: Given the data on y and x,what
Q6: The log-log and exponential models,ln(y)= β<sub>0</sub> +
Q7: Exhibit 16.6.Thirty employed single individuals were randomly
Q8: Exhibit 16-7.It is believed that the sales
Q9: Exhibit 16.6.Thirty employed single individuals were randomly
Q10: Exhibit 16-7.It is believed that the sales
Q11: Exhibit 16.5.The following data shows the demand
Q14: Many nonlinear regression models can be studied
Q24: The fit of the models y =