Multiple Choice
Exhibit 16.5.The following data shows the demand for an airline ticket dependent on the price of this ticket. 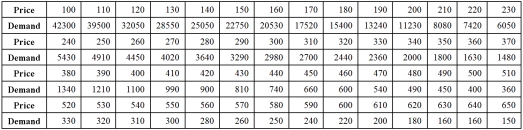 For the assumed cubic and log-log regression models,Demand = β0 + β1Price + β2Price2 + β3Price3 + ε and ln(Demand) = β0 + β1ln(Price) + ε,the following regression results are available:
 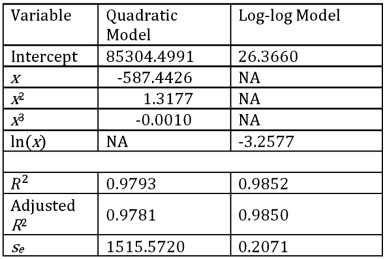 Refer to Exhibit 16.5.What does the slope of the obtained regression equation
  signify?
A) For every 1% increase in the price,the predicted demand declines by approximately 3.2577%.
B) For every 1% increase in the demand,the expected price increases by approximately 3.2577%.
C) For every 1% increase in the demand,the expected price decreases by approximately 3.2577%.
D) For every 1% increase in the price,the predicted demand increases by approximately 3.2577%.
Correct Answer:

Verified
Correct Answer:
Verified
Q6: The log-log and exponential models,ln(y)= β<sub>0</sub> +
Q7: Exhibit 16.6.Thirty employed single individuals were randomly
Q8: Exhibit 16-7.It is believed that the sales
Q9: Exhibit 16.6.Thirty employed single individuals were randomly
Q10: Exhibit 16-7.It is believed that the sales
Q13: Exhibit 16-7.It is believed that the sales
Q15: Exhibit 16-1.The following Excel scatterplot with the
Q16: Exhibit 16-1.The following Excel scatterplot with the
Q20: The equation y = β<sub>0</sub> + β<sub>1</sub>x
Q72: A model in which the response variable