Multiple Choice
The accompanying table shows the regression results when estimating 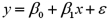 .Is x significantly related to y at the 5% significance level?
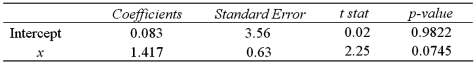
A) Yes,since the p-value of 0.0745 is greater than 0.05.
B) No,since the p-value of 0.0745 is greater than 0.05.
C) Yes,since the slope coefficient of 1.417 is less than the test statistic of 2.25.
D) No,since the slope coefficient of 1.417 is less than the test statistic of 2.25.
Correct Answer:

Verified
Correct Answer:
Verified
Q40: The accompanying table shows the regression results
Q42: Exhibit 15-4.A researcher analyzes the factors that
Q46: A manager at a local bank analyzed
Q47: A researcher analyzes the factors that may
Q48: A simple linear regression, <img src="https://d2lvgg3v3hfg70.cloudfront.net/TB2339/.jpg" alt="A
Q49: A sociologist estimates the following regression relating
Q50: When estimating a multiple regression model based
Q71: In a multiple regression based on 30
Q74: When some explanatory variables of a regression
Q121: The alternative hypothesis for the test of