Essay
The accompanying table shows the regression results when estimating  .
. 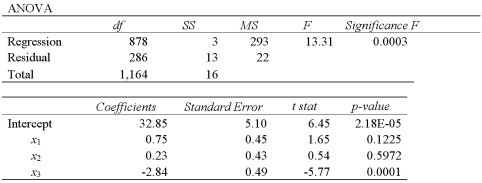 a.Specify the competing hypotheses to determine whether the explanatory variables are jointly significant.
B)At the 5% significance level,are the explanatory variables jointly significant? Explain.
C)At the 5% significance level,is x2 significant in explaining y? Explain.
D)At the 5% significance level,is the slope coefficient attached to x3 different from -2?
Correct Answer:

Verified
a.  versus b.Yes,since the p-value of 0...
View Answer
Unlock this answer now
Get Access to more Verified Answers free of charge
Correct Answer:
Verified
View Answer
Unlock this answer now
Get Access to more Verified Answers free of charge
Q35: A sociologist studies the relationship between a
Q36: One of the assumptions of regression analysis
Q38: Exhibit 15-1.An marketing analyst wants to examine
Q39: When estimating <img src="https://d2lvgg3v3hfg70.cloudfront.net/TB2339/.jpg" alt="When estimating
Q42: Exhibit 15-4.A researcher analyzes the factors that
Q45: The accompanying table shows the regression results
Q71: In a multiple regression based on 30
Q74: When some explanatory variables of a regression
Q121: The alternative hypothesis for the test of
Q124: The restricted model is a reduced model