Essay
A researcher analyzes the relationship between amusement park attendance and the price of admission.She estimates the following model: 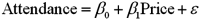 ,
,
where Attendance is the daily attendance (in 1000s)and Price is the gate price (in $).A portion of the regression results is shown in the accompanying table. 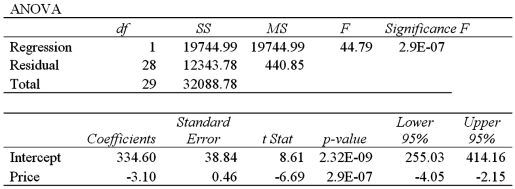 a.Predict the Attendance for an amusement park that charges $80 for admission.
B)Interpret the slope coefficient attached to Price.
C)Calculate the standard error of the estimate.If the sample mean for Attendance is 75.9,what can you infer about the model's predictive power.
D)Calculate and interpret the coefficient of determination.How much of the variability in Attendance is unexplained.
Correct Answer:

Verified
Correct Answer:
Verified
Q2: Consider the following simple linear regression model:
Q3: A statistics instructor wants to examine the
Q4: Exhibit 14-6.A manager at a local bank
Q5: An economist examines the relationship between the
Q6: In the estimation of a multiple regression
Q7: Exhibit 14-9.When estimating <img src="https://d2lvgg3v3hfg70.cloudfront.net/TB2339/.jpg" alt="Exhibit 14-9.When
Q8: Given the augmented Phillips model: <img src="https://d2lvgg3v3hfg70.cloudfront.net/TB2339/.jpg"
Q9: Consider the following sample data: <img src="https://d2lvgg3v3hfg70.cloudfront.net/TB2339/.jpg"
Q10: Using the same data set,four models are
Q70: Each point in the scatterplot represents one