Multiple Choice
Exhibit 12.2 A university has six colleges and takes a poll to gauge student support for a tuition increase.The university wants to insure each college is represented fairly.The below table shows the observed number students that participate in the poll from each college and the actual proportion of students in each college. 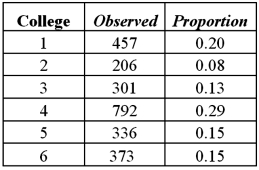 Refer to Exhibit 12.2.Using the p-value approach and α = 0.01,the decision and conclusion are:
A) Do not reject the null hypothesis;all proportions are equal to 
B) Do not reject the null hypothesis;cannot conclude that not all of the proportions are the same
C) Reject the null hypothesis;at least one of the proportions is different from its hypothesized value
D) Reject the null hypothesis;all of the proportions are not the same
Correct Answer:

Verified
Correct Answer:
Verified
Q34: A goodness-of-fit test analyzes for two qualitative
Q58: For a multinomial experiment with k categories,
Q90: Exhibit 12.4 In the following table,likely voters'
Q91: Suppose you want to determine if mutual
Q93: Exhibit 12.2 A university has six colleges
Q97: For the goodness-of-fit test,the sum of the
Q98: For the chi-square test of a contingency
Q99: Exhibit 12.7 The heights (in cm)for a
Q100: Exhibit 12.8 The heights (in cm)for a
Q104: The chi-square test statistic measures the difference