Multiple Choice
Exhibit 12.7 The heights (in cm) for a random sample of 60 males were measured.The sample mean is 166.55,the standard deviation is 12.57,the sample kurtosis is 0.12,and the sample skewness is -0.23.The following table shows the heights subdivided into non-overlapping intervals. 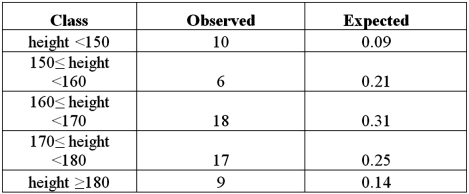 Refer to Exhibit 12.7.For the chi-square test for normality,the null and alternative hypothesis are:
A) 
B) 
C) 
D) 
Correct Answer:

Verified
Correct Answer:
Verified
Q34: A goodness-of-fit test analyzes for two qualitative
Q58: For a multinomial experiment with k categories,
Q90: Exhibit 12.4 In the following table,likely voters'
Q91: Suppose you want to determine if mutual
Q93: Exhibit 12.2 A university has six colleges
Q95: Exhibit 12.2 A university has six colleges
Q97: For the goodness-of-fit test,the sum of the
Q98: For the chi-square test of a contingency
Q100: Exhibit 12.8 The heights (in cm)for a
Q104: The chi-square test statistic measures the difference