Multiple Choice
Exhibit 12.5 In the following table,individuals are cross-classified by their age group and income level. 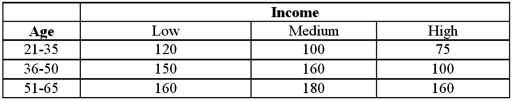 Refer to Exhibit 12.5.The p-value is:
A) Less than 0.01
B) Between 0.01 and 0.05
C) Between 0.05 and 0.10
D) Greater than 0.10
Correct Answer:

Verified
Correct Answer:
Verified
Related Questions
Q2: For the goodness-of-fit test, the chi-square test
Q31: Exhibit 12.6 The following table shows the
Q32: Exhibit 12.4 In the following table,likely voters'
Q33: Exhibit 12.3 A fund manager wants to
Q35: Exhibit 12-1 A card dealing machine deals
Q37: Exhibit 12.4 In the following table,likely voters'
Q38: Exhibit 12.7 The heights (in cm)for a
Q39: Exhibit 12.3 A fund manager wants to
Q41: For the chi-square test of a contingency
Q102: For a chi-square test of a contingency