Multiple Choice
Exhibit 12.7 The heights (in cm) for a random sample of 60 males were measured.The sample mean is 166.55,the standard deviation is 12.57,the sample kurtosis is 0.12,and the sample skewness is -0.23.The following table shows the heights subdivided into non-overlapping intervals. 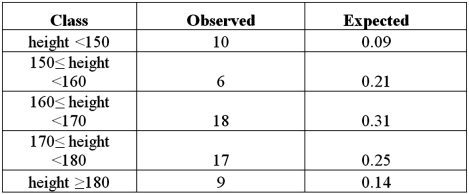 Refer to Exhibit 12.7.For the heights subdivided into five intervals,the expected frequency of males that weigh less than 150 is:
A) 5.4
B) 12.6
C) 18.6
D) 8.4
Correct Answer:

Verified
Correct Answer:
Verified
Q2: For the goodness-of-fit test, the chi-square test
Q33: Exhibit 12.3 A fund manager wants to
Q35: Exhibit 12-1 A card dealing machine deals
Q36: Exhibit 12.5 In the following table,individuals are
Q37: Exhibit 12.4 In the following table,likely voters'
Q39: Exhibit 12.3 A fund manager wants to
Q41: For the chi-square test of a contingency
Q42: Exhibit 12.5 In the following table,individuals are
Q43: For a multinomial experiment,which of the following
Q102: For a chi-square test of a contingency