Multiple Choice
Exhibit 12.7 The heights (in cm) for a random sample of 60 males were measured.The sample mean is 166.55,the standard deviation is 12.57,the sample kurtosis is 0.12,and the sample skewness is -0.23.The following table shows the heights subdivided into non-overlapping intervals. 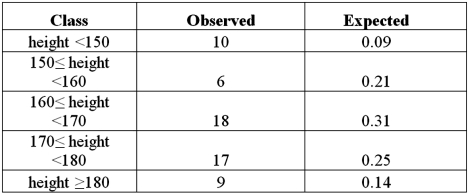 Refer to Exhibit 12.7.For the goodness-of-fit test for normality,suppose the value of the test statistic is 7.71.The p-value is:
A) Less than 0.01
B) Between 0.01 and 0.05
C) Between 0.05 and 0.10
D) Greater than 0.10
Correct Answer:

Verified
Correct Answer:
Verified
Q16: For a chi-square test of a contingency
Q21: Exhibit 12.5 In the following table,individuals are
Q22: The chi-square test of a contingency table
Q23: The following table shows the observed frequencies
Q24: For the chi-square test for normality,the expected
Q27: The calculation of the Jarque-Bera test statistic
Q29: Exhibit 12.5 In the following table,individuals are
Q31: Exhibit 12.6 The following table shows the
Q100: When applying the goodness-of-fit test for normality,the
Q116: What are the degrees of freedom for