Essay
The following table shows the observed frequencies of the amount of assets under management for a sample of 134 hedge funds.The table also contains the hypothesized proportion of each class assuming the amount of assets under management has a normal distribution.The sample mean and standard deviation are 15 billion and 11 billion respectively. 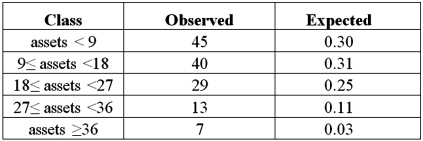
A)Set up the competing hypotheses for the goodness-of-fit test of normality for amount of assets under management.
B)Calculate the value of the test statistic and determine the degrees of freedom.
C)Specify the critical value at the 5% significance level.
D)Is there evidence to suggest the amount of assets under management do not have a normal distribution?
E)Are there any conditions which may not be satisfied?
Correct Answer:

Verified
 The value of the test statistic is give...
View Answer
Unlock this answer now
Get Access to more Verified Answers free of charge
Correct Answer:
Verified
View Answer
Unlock this answer now
Get Access to more Verified Answers free of charge
Q16: For a chi-square test of a contingency
Q19: Exhibit 12.4 In the following table,likely voters'
Q20: Exhibit 12-1 A card dealing machine deals
Q21: Exhibit 12.5 In the following table,individuals are
Q22: The chi-square test of a contingency table
Q24: For the chi-square test for normality,the expected
Q26: Exhibit 12.7 The heights (in cm)for a
Q27: The calculation of the Jarque-Bera test statistic
Q48: A travel agent wants to determine if
Q100: When applying the goodness-of-fit test for normality,the