Multiple Choice
The following frequency distribution represents the number of hours studied per week by a sample of 50 students. 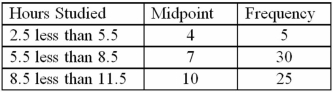 The standard deviation of the number of hours studied is:
A) 1.89
B) 2.79
C) 3.50
D) 3.56
Correct Answer:

Verified
Correct Answer:
Verified
Related Questions
Q11: The arithmetic mean is the middle value
Q20: The coefficient of variation is a unit-free
Q61: The sample data below shows the number
Q64: As of September 30,2011,the earnings per share,EPS,of
Q65: The following table shows the annual returns
Q68: The following data is a list of
Q69: A portfolio's annual total returns (in percent)for
Q70: The following frequency distribution represents the number
Q71: The following is data a veterinarian collected
Q104: What does the covariance measure?<br>A) The direction