Essay
The table shows the price of motor fuel (mainly gasoline)and the overall price level (the consumer price index)in five-year intervals over the period 1970 through 1990. 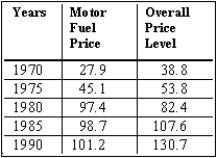 (A)Plot a diagram of the relative price of motor fuel for the 1970-1990 period.
(B)Explain what has been happening to the relative price of motor fuel over this period.
Correct Answer:

Verified
(A)The plot of the diagram is shown in t...View Answer
Unlock this answer now
Get Access to more Verified Answers free of charge
Correct Answer:
Verified
View Answer
Unlock this answer now
Get Access to more Verified Answers free of charge
Q8: In describing the relationship between X and
Q49: Exhibit 2-3<br> <img src="https://d2lvgg3v3hfg70.cloudfront.net/TB6906/.jpg" alt="Exhibit 2-3
Q70: Knowledge of economics will help you make
Q92: Consider an economic model of CD production.Represent
Q95: Experimental economics<br>A)is the dominant method in economics.<br>B)does
Q97: Exhibit 2-1 <img src="https://d2lvgg3v3hfg70.cloudfront.net/TB6035/.jpg" alt="Exhibit 2-1
Q101: Which of the following is not an
Q112: A microeconomic model must be much smaller
Q115: What is the difference between correlation and
Q123: Economic models differ from those in the