Multiple Choice
Exhibit 2-1 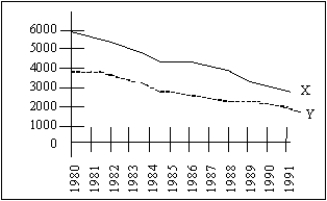
-Exhibit 2-1 shows movements of two variables,X and Y,from 1980 through 1991.From this diagram the most one can conclude is that
A) X and Y are positively correlated with each other.
B) X and Y are negatively correlated with each other.
C) X and Y are positively correlated with each other and either X causes Y or Y causes X.
D) we cannot say anything about how X and Y are related because we do not know the units of measurement for X and Y.
E) X and Y are not correlated with each other.
Correct Answer:

Verified
Correct Answer:
Verified
Q49: Exhibit 2-3<br> <img src="https://d2lvgg3v3hfg70.cloudfront.net/TB6906/.jpg" alt="Exhibit 2-3
Q70: Knowledge of economics will help you make
Q92: Consider an economic model of CD production.Represent
Q95: Experimental economics<br>A)is the dominant method in economics.<br>B)does
Q96: The table shows the price of motor
Q101: Which of the following is not an
Q112: A microeconomic model must be much smaller
Q115: What is the difference between correlation and
Q123: Economic models differ from those in the
Q133: "Inflation is a more serious problem than