Essay
Refer to the table below,which shows data for the United States. 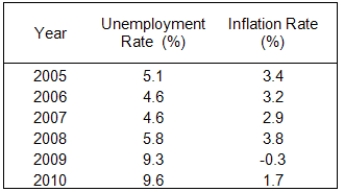 (A)Construct a time-series plot of the unemployment rate.
(B)Construct a time-series plot of the inflation rate.
(C)Construct a scatter plot of the data.Is there any apparent correlation between the inflation rate and the unemployment rate in these data?
Correct Answer:

Verified
(A) A time-series plot of the unemployme...View Answer
Unlock this answer now
Get Access to more Verified Answers free of charge
Correct Answer:
Verified
View Answer
Unlock this answer now
Get Access to more Verified Answers free of charge
Q11: Exhibit 2A-2 <img src="https://d2lvgg3v3hfg70.cloudfront.net/TB6035/.jpg" alt="Exhibit 2A-2
Q13: Refer to the table below.Analyze the data
Q13: A two-dimensional graph cannot be used to
Q44: Exhibit 2A-8 <img src="https://d2lvgg3v3hfg70.cloudfront.net/TB6906/.jpg" alt="Exhibit 2A-8
Q81: Exhibit 2A-7 <img src="https://d2lvgg3v3hfg70.cloudfront.net/TB6906/.jpg" alt="Exhibit 2A-7
Q82: Exhibit 2A-5<br> <img src="https://d2lvgg3v3hfg70.cloudfront.net/TB6906/.jpg" alt="Exhibit 2A-5
Q86: Exhibit 2A-3 <img src="https://d2lvgg3v3hfg70.cloudfront.net/TB6906/.jpg" alt="Exhibit 2A-3
Q90: Exhibit 2A-1 <img src="https://d2lvgg3v3hfg70.cloudfront.net/TB6906/.jpg" alt="Exhibit 2A-1
Q91: A positive relationship represents a situation where
Q118: Exhibit 2A-8 <img src="https://d2lvgg3v3hfg70.cloudfront.net/TB6906/.jpg" alt="Exhibit 2A-8