Essay
Refer to the table below.Analyze the data on the number of meals served at small and large restaurants.The number of meals served will vary with the number of cooks employed at the restaurant. 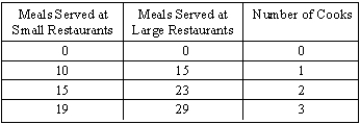 (A)Show the relationship between cooks and meals served by graphing two curves with cooks on the horizontal axis and the number of meals on the vertical axis.How do the slopes of the curves change as more cooks are employed?
(B)Is the change in the number of cooks a shift in the curve or a movement along the curve?
(C)Is the change in the size of the restaurant a shift in the curve or a movement along the curve?
Correct Answer:

Verified
(A) The relationship between cooks and m...View Answer
Unlock this answer now
Get Access to more Verified Answers free of charge
Correct Answer:
Verified
View Answer
Unlock this answer now
Get Access to more Verified Answers free of charge
Q11: Exhibit 2A-2 <img src="https://d2lvgg3v3hfg70.cloudfront.net/TB6035/.jpg" alt="Exhibit 2A-2
Q12: Refer to the table below,which shows data
Q13: A two-dimensional graph cannot be used to
Q49: An inverse relationship between two variables indicates
Q81: Exhibit 2A-7 <img src="https://d2lvgg3v3hfg70.cloudfront.net/TB6906/.jpg" alt="Exhibit 2A-7
Q82: Exhibit 2A-5<br> <img src="https://d2lvgg3v3hfg70.cloudfront.net/TB6906/.jpg" alt="Exhibit 2A-5
Q86: Exhibit 2A-3 <img src="https://d2lvgg3v3hfg70.cloudfront.net/TB6906/.jpg" alt="Exhibit 2A-3
Q90: Exhibit 2A-1 <img src="https://d2lvgg3v3hfg70.cloudfront.net/TB6906/.jpg" alt="Exhibit 2A-1
Q91: A positive relationship represents a situation where
Q118: Exhibit 2A-8 <img src="https://d2lvgg3v3hfg70.cloudfront.net/TB6906/.jpg" alt="Exhibit 2A-8