Multiple Choice
An introductory statistics class decides to investigate whether there is a relationship between the performance on midterms 1 and 2. The instructor creates a scatterplot of midterm 2 scores (y) versus midterm 1 scores (x) . 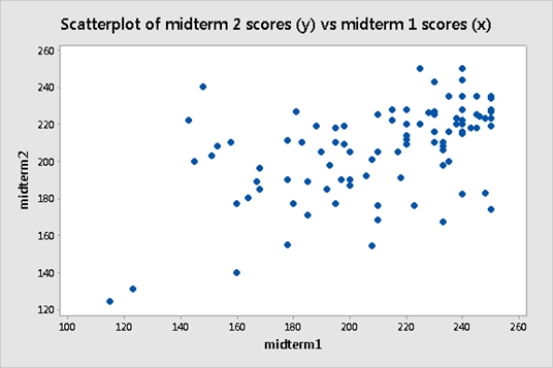 Based on the plot, which of the following is likely true?
A) The correlation between midterm 1 and midterm 2 scores is positive.
B) Students who did well on midterm 1 did not do so well on midterm 2, and vice versa.
C) There is no relationship between midterm 1 and midterm 2 performance.
D) None of the answer options is correct.
Correct Answer:

Verified
Correct Answer:
Verified
Q12: A researcher measures the correlation between two
Q13: Consider the following scatterplot, which depicts the
Q14: Archaeologists often find only parts of ancient
Q15: For each menu item at a fast
Q16: Colleges often rely heavily on raising money
Q18: An economist conducted a study of the
Q19: The volume of oxygen consumed (in liters
Q20: A researcher states that bone density in
Q21: An economist conducted a study of the
Q22: An economist conducted a study of the