Multiple Choice
For each menu item at a fast food restaurant, the fat content (in grams) and the number of calories were recorded. A scatterplot of these data is given: 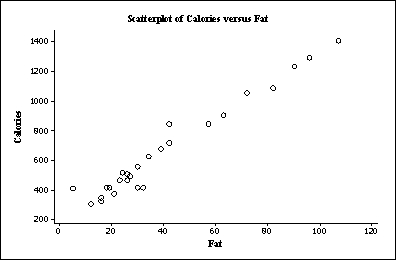 A plausible value for the correlation between fat content and number of calories is:
A) +0.2.
B) -0.9.
C) +0.9.
D) -1.0.
Correct Answer:

Verified
Correct Answer:
Verified
Q10: The graph below shows a scatterplot of
Q11: An economist conducted a study of the
Q12: A researcher measures the correlation between two
Q13: Consider the following scatterplot, which depicts the
Q14: Archaeologists often find only parts of ancient
Q16: Colleges often rely heavily on raising money
Q17: An introductory statistics class decides to investigate
Q18: An economist conducted a study of the
Q19: The volume of oxygen consumed (in liters
Q20: A researcher states that bone density in