Multiple Choice
An economist conducted a study of the possible association between weekly income and weekly grocery expenditures. The particular interest was whether higher income would cause shoppers to spend more on groceries. A random sample of shoppers at a local supermarket was obtained. A questionnaire was administered asking about the weekly income of each shopper's family and their grocery bill for that week. The data below are for 10 selected survey participants: 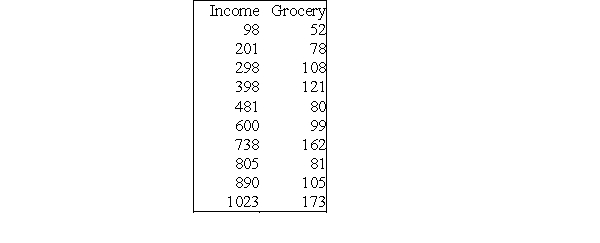 The scatterplot with a linear trend line is given below:
 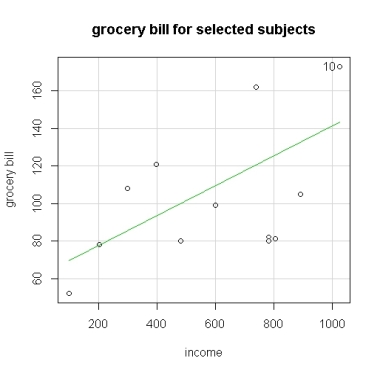 If the expenditure for subject 7 is decreased and for subject 8 is increased, the effect on the correlation:
A) will be to decrease it.
B) will be to increase it.
C) will be no effect.
D) cannot be determined without knowing the new values for expenditure.
Correct Answer:

Verified
Correct Answer:
Verified
Q2: What can be said of the correlation
Q3: A scatterplot can be used to illustrate
Q4: An economist conducted a study of the
Q5: An economist conducted a study of the
Q6: A student wonders if people with similar
Q8: An economist conducted a study of the
Q9: A scatterplot of the amount of alcohol
Q10: The graph below shows a scatterplot of
Q11: An economist conducted a study of the
Q12: A researcher measures the correlation between two