Multiple Choice
The graph below shows a scatterplot of midterm scores plotted against homework scores. The graph contains several points that correspond to unusually low homework scores, and one of those scores is associated with the highest midterm score. 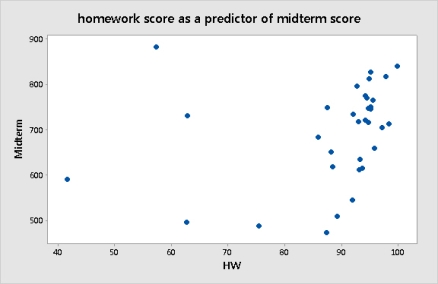 Removing this point will:
A) increase the correlation.
B) leave the correlation unchanged.
C) decrease the correlation.
D) The effect cannot be determined from the scatterplot.
Correct Answer:

Verified
Correct Answer:
Verified
Q5: An economist conducted a study of the
Q6: A student wonders if people with similar
Q7: An economist conducted a study of the
Q8: An economist conducted a study of the
Q9: A scatterplot of the amount of alcohol
Q11: An economist conducted a study of the
Q12: A researcher measures the correlation between two
Q13: Consider the following scatterplot, which depicts the
Q14: Archaeologists often find only parts of ancient
Q15: For each menu item at a fast