Multiple Choice
Investigators gave caffeine to fruit flies to see if it affected their rest. The four treatments were a control, a low caffeine dose of 1 mg/ml of blood, a medium dose of 3 mg/ml of blood, and a higher caffeine dose of 5 mg/ml of blood. Twelve fruit flies were assigned at random to the four treatments, three to each treatment, and the minutes of rest measured over a 24-hour period were recorded. Assume the data that follow are four independent SRSs (one from each of the four populations of caffeine levels) and that the distribution of the yields is Normal. 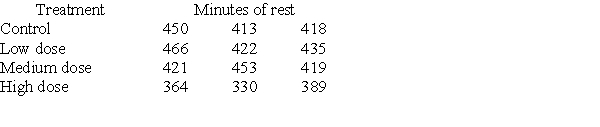 A partial ANOVA table produced by Minitab follows, along with the means and standard deviation of the yields for the four groups.
 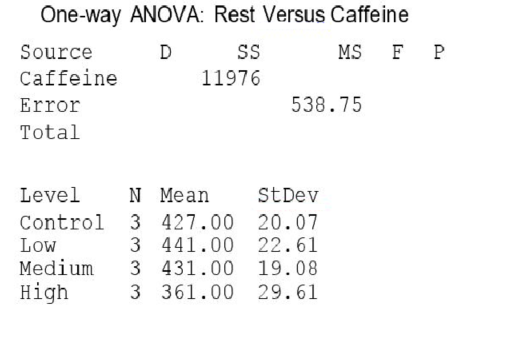 The P-value of this test is:
A) greater than 0.1.
B) between 0.05 and 0.1.
C) less than 0.05.
D) It is not possible to determine the P-value from the information provided.
Correct Answer:

Verified
Correct Answer:
Verified
Q18: At what age do babies learn to
Q19: A traffic engineer wanted to study the
Q20: A company runs a three-day workshop on
Q21: The one-way ANOVA is a generalization of
Q22: Investigators gave caffeine to fruit flies to
Q23: Investigators gave caffeine to fruit flies to
Q24: Which of the following is a true
Q25: Investigators gave caffeine to fruit flies to
Q27: Many Americans complain about being sleep deprived.
Q28: A company runs a three-day workshop on