Multiple Choice
The following is a scatterplot of a company's profits versus their sales (in dollars) . Each point on the plot represents profits and sales during one of the months in the sample. 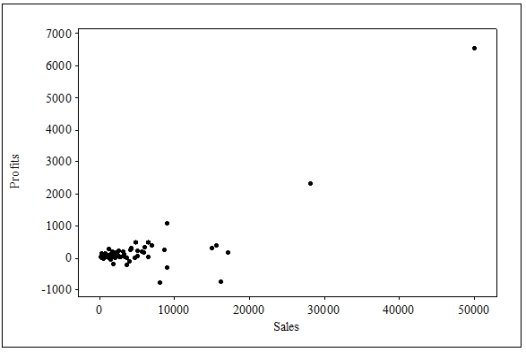 Which of the following statements is supported by the plot?
A) There is no striking evidence that the assumptions for regression are violated and there is a clear, straight-line trend.
B) There are very influential observations suggesting that the least-squares regression line must be interpreted with extreme caution.
C) The plot contains dramatic evidence that the standard deviation of the response about the true regression line is not even approximately the same everywhere.
D) The plot contains many fewer points than are needed to fit the least-squares regression line; obviously there is a major error present.
Correct Answer:

Verified
Correct Answer:
Verified
Q12: The scatterplot below suggests a linear relationship
Q13: The scatterplot below suggests a linear relationship
Q14: The scatterplot below suggests a linear relationship
Q15: The following is a scatterplot of a
Q16: Forced expiratory volume (FEV) is the volume
Q18: A study of obesity risk in children
Q19: You can visit the official website of
Q20: You can visit the official website of
Q21: The following is a plot of the
Q22: The following is a scatterplot of a