Multiple Choice
The scatterplot below suggests a linear relationship between the age (in years) of an antique clock and its sale price (in euros) at auction. The data are age and sale price for 11 antique clocks sold at a recent auction. 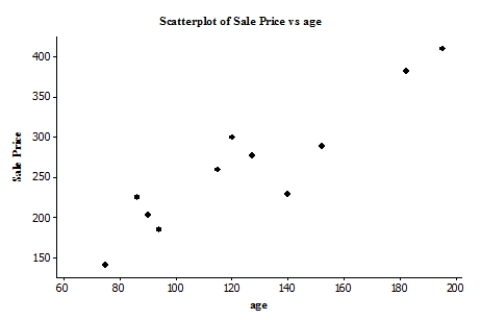 We fit the least-squares regression line to the model price = + (age) , where the deviations are assumed to be independent and Normally distributed, with mean 0 and standard deviation . A summary of the output is given. r2 = 0.848
S = 33.1559 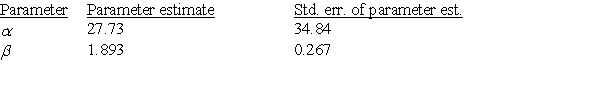 An approximate 95% confidence interval for the slope in the simple linear regression model is:
A) 1.289 to 2.497 euros per year.
B) 1.289 to 2.497 euros.
C) 1.289 to 2.497 years per euro.
D) None of the answer options is correct.
Correct Answer:

Verified
Correct Answer:
Verified
Q8: A study of obesity risk in children
Q9: A study of obesity risk in children
Q10: A random sample of 19 companies from
Q11: A random sample of 19 companies from
Q12: The scatterplot below suggests a linear relationship
Q14: The scatterplot below suggests a linear relationship
Q15: The following is a scatterplot of a
Q16: Forced expiratory volume (FEV) is the volume
Q17: The following is a scatterplot of a
Q18: A study of obesity risk in children