Multiple Choice
A study of obesity risk in children in a head start program used a food score calculated from a 45-question food survey to predict body mass index (BMI) percentile in these children 18 months after the initial survey. The study enrolled 20 children. The researchers used a linear regression model for the prediction of BMI percentile. The food scores ranged from 45 to 245. 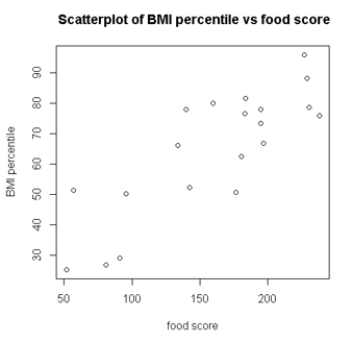 Which feature, supported by the scatterplot, is important to determine if a linear regression model can be used?
A) scatter of points around a straight line
B) even spread at each value of food score
C) correlation between BMI percentiles for subjects with similar food scores
D) options (a) and (b) only
Correct Answer:

Verified
Correct Answer:
Verified
Q3: A random sample of 19 companies from
Q4: You can visit the official website of
Q5: Frequent food questionnaires (FFQs) are often given
Q6: A study of obesity risk in children
Q7: A study of obesity risk in children
Q9: A study of obesity risk in children
Q10: A random sample of 19 companies from
Q11: A random sample of 19 companies from
Q12: The scatterplot below suggests a linear relationship
Q13: The scatterplot below suggests a linear relationship