Essay
Annual estimates of the population in the age group 65+ in a mid-sized city from 1999 (t = 1) onward are shown in the time series graph below. 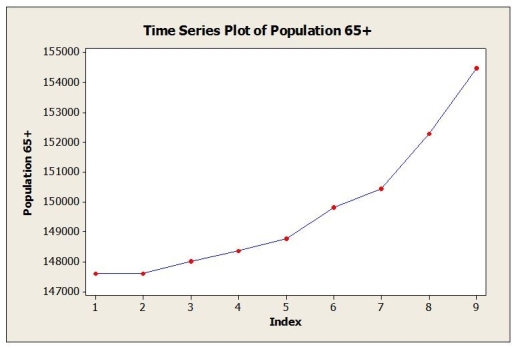 a. Identify the dominant time series component(s) in the data.
b. Below are the results from fitting a linear trend model to the data. Use this model to estimate the 65+ population in this city for 2008 (t = 10). 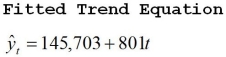 c. Below are the results from fitting a quadratic trend model to the data. Use this model to estimate the 65+ population in this city for 2008 (t = 10).
 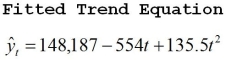 d. The actual population estimate for 2008 is 157,218. Which model does better? Why?
Correct Answer:

Verified
a. Trend
b. 153,713
c. 156,197...View Answer
Unlock this answer now
Get Access to more Verified Answers free of charge
Correct Answer:
Verified
b. 153,713
c. 156,197...
View Answer
Unlock this answer now
Get Access to more Verified Answers free of charge
Q1: Consider the following to answer the question(s)
Q2: A large automobile parts supplier keeps track
Q3: Consider the following to answer the question(s)
Q5: Which of the following statistical measures is(are)
Q7: A company has recorded annual sales for
Q8: Consider the following to answer the question(s)
Q9: Monthly closing stock prices, adjusted for dividends,
Q10: The table below shows the actual closing
Q23: Consider the following to answer the question(s)
Q24: If you suspect that your trend forecasting