Multiple Choice
Consider the following to answer the question(s) below:
Quarterly sales data (in $10,000) for a small company specializing in green cleaning products are shown in the time series graph below. 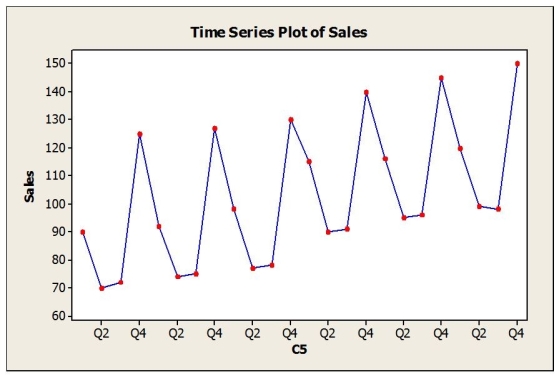 A seasonal regression model was fit to these data and the results are shown below.
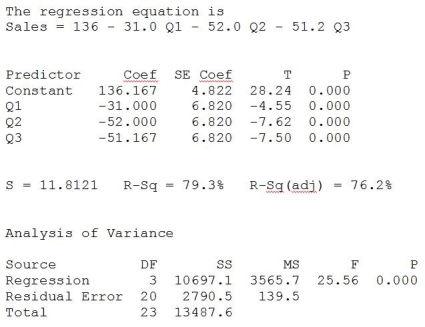
-Which of the following is (are) true?
A) The seasonal regression model is significant in explaining sales as indicated by the F-statistic and associated P-value.
B) The seasonal regression model explains 79.3% of the variation in sales.
C) The t-statistics and associated P-values indicate that all dummy variables representing quarters are significant.
D) The seasonal regression model is significant in explaining sales as indicated by the F-statistic and associated P-value and the seasonal regression model explains 79.3% of the variation in sales.
E) All of the statements given here are true.
Correct Answer:

Verified
Correct Answer:
Verified
Q2: A large automobile parts supplier keeps track
Q3: Consider the following to answer the question(s)
Q5: Which of the following statistical measures is(are)
Q6: Annual estimates of the population in the
Q7: A company has recorded annual sales for
Q8: Consider the following to answer the question(s)
Q9: Monthly closing stock prices, adjusted for dividends,
Q10: The table below shows the actual closing
Q23: Consider the following to answer the question(s)
Q24: If you suspect that your trend forecasting