Multiple Choice
Consider the following to answer the question(s) below:
Quarterly sales data (in $10,000) for a small company specializing in green cleaning products are shown in the time series graph below. 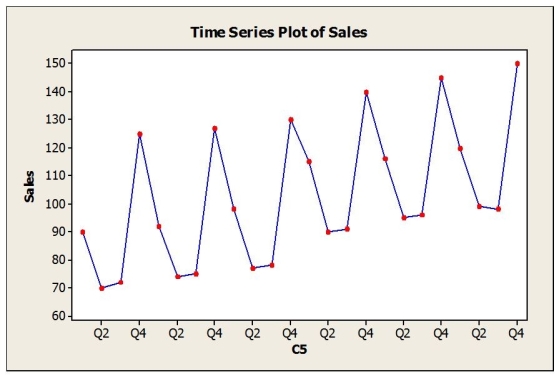 A seasonal regression model was fit to these data and the results are shown below.
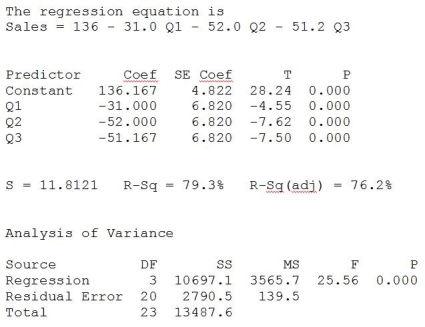
-The regression coefficients in the seasonal regression model indicate that
A) Sales are, on average, lower in the first, second and third quarters compared with the fourth quarter.
B) Sales are, on average, lowest in the fourth quarter.
C) Sales are, on average, higher in the first, second and third quarters compared with the fourth quarter.
D) Sales are, on average, lowest in the first quarter.
E) Sales are, on average, lowest in the second quarter.
Correct Answer:

Verified
Correct Answer:
Verified
Q7: A company has recorded annual sales for
Q8: Consider the following to answer the question(s)
Q9: Monthly closing stock prices, adjusted for dividends,
Q10: The table below shows the actual closing
Q13: Quarterly sales data (in $10,000) for a
Q14: Consider the following to answer the question(s)
Q15: Consider the following to answer the question(s)
Q16: Annual estimates of the population in a
Q17: Consider the following to answer the question(s)
Q23: Consider the following to answer the question(s)