Essay
Annual estimates of the population in a certain city from 1999 (t = 1) onward are shown in the time series graph below. 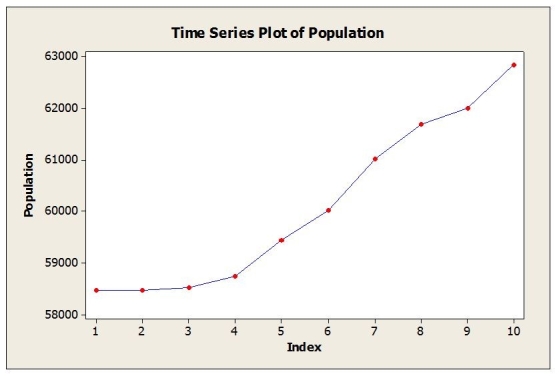 a. Identify the dominant time series component(s) in the data.
b. Below are the results from fitting a linear trend model to the data. Use this model to estimate the population in this city for 2008 (t = 10). 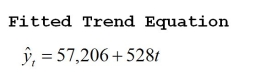 c. Below are the results from fitting a quadratic trend model to the data. Use this model to estimate the population in this city for 2008 (t = 10).
 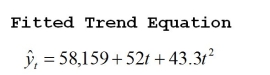 d. The actual population estimate for 2008 is 62,828. Which model does better? Why?
Correct Answer:

Verified
a. Trend
b. 62,486
c. 63,009
d...View Answer
Unlock this answer now
Get Access to more Verified Answers free of charge
Correct Answer:
Verified
b. 62,486
c. 63,009
d...
View Answer
Unlock this answer now
Get Access to more Verified Answers free of charge
Q12: Consider the following to answer the question(s)
Q13: Quarterly sales data (in $10,000) for a
Q14: Consider the following to answer the question(s)
Q15: Consider the following to answer the question(s)
Q17: Consider the following to answer the question(s)
Q18: Consider the following to answer the question(s)
Q19: Consider the following to answer the question(s)
Q20: Daily closing stock prices for Kyocera Corporation
Q21: Consider the following to answer the question(s)
Q23: Consider the following to answer the question(s)