Essay
The following scatterplot shows world population (millions) plotted against 5 year intervals from 1950 through 2000.
a. Based on the scatterplot, is the linear model appropriate? Explain. 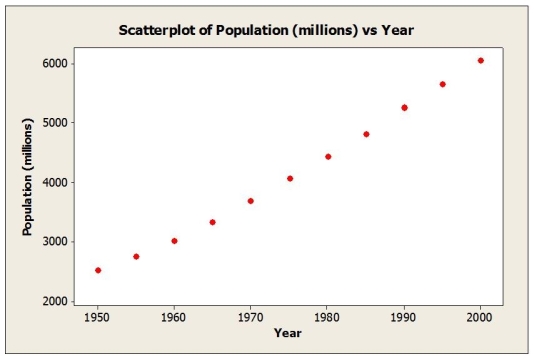 b. A linear regression model was estimated to describe the trend in world population over time. Based on the plot of residuals versus predicted values shown below, would you consider this model appropriate? Explain.
 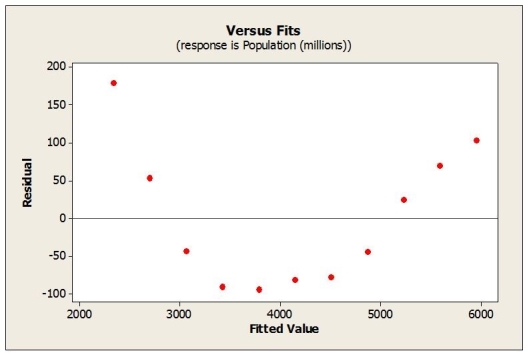 c. Would a re-expression of the data help? If so, what would you recommend?
Correct Answer:

Verified
a. The scatterplot appears straight enou...View Answer
Unlock this answer now
Get Access to more Verified Answers free of charge
Correct Answer:
Verified
View Answer
Unlock this answer now
Get Access to more Verified Answers free of charge
Q15: Consider the following to answer the question(s)
Q16: Consider the following to answer the question(s)
Q17: A new movie is in the making
Q18: The best practice for modelling this data
Q21: Which of the following re-expressions of the
Q22: Consider the following to answer the question(s)
Q22: A regression model was developed relating average
Q23: Data on Internet usage (per 100 inhabitants)
Q24: Consider the following to answer the question(s)
Q25: Consider the following to answer the question(s)