Multiple Choice
Consider the following to answer the question(s) below:
Suppose that data on labour productivity and unit labour costs were obtained for the retail industry from 1990 through 2009. A regression was estimated to describe the linear relationship between the two variables. 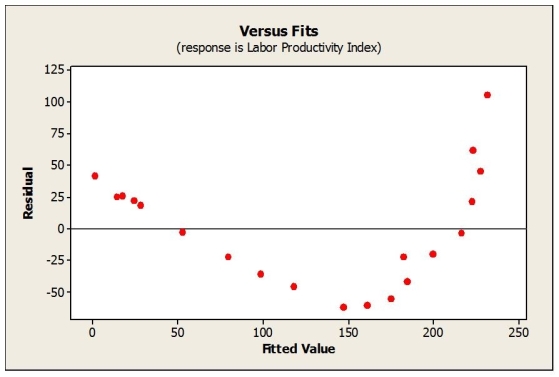
-What does the plot of residuals suggest?
A) The linearity condition is not satisfied, and the equal spread condition is not satisfied.
B) The data are not normal.
C) The equal variance condition is not met.
D) The linearity condition is not met.
E) The linearity condition is not met and the data is not normal.
Correct Answer:

Verified
Correct Answer:
Verified
Q11: Consider the following to answer the question(s)
Q12: Consider the following to answer the question(s)
Q13: Quarterly figures for e-commerce retail sales were
Q14: Consider the following to answer the question(s)
Q15: Consider the following to answer the question(s)
Q17: A new movie is in the making
Q18: The best practice for modelling this data
Q20: The following scatterplot shows world population (millions)
Q21: Which of the following re-expressions of the
Q22: Consider the following to answer the question(s)