Multiple Choice
Consider the following to answer the question(s) below:
Monthly closing stock prices for a utility company were obtained from January 2007 through August 2008. A regression model was estimated to describe the trend in closing stock prices over time. 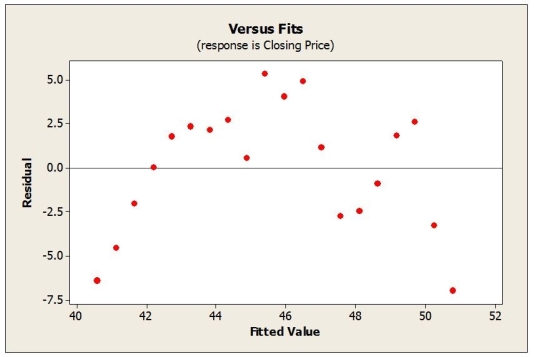
-What does the plot of residuals below suggest?
A) An outlier is present in the data set.
B) The linearity condition is not satisfied.
C) A high leverage point is present in the data set.
D) The data are not normal.
E) The equal spread condition is not satisfied.
Correct Answer:

Verified
Correct Answer:
Verified
Q18: Consider the following to answer the question(s)
Q18: The best practice for modelling this data
Q20: The following scatterplot shows world population (millions)
Q21: Which of the following re-expressions of the
Q22: A regression model was developed relating average
Q22: Consider the following to answer the question(s)
Q23: Data on Internet usage (per 100 inhabitants)
Q24: Consider the following to answer the question(s)
Q25: Consider the following to answer the question(s)
Q28: Quarterly sales figures for e-commerce retail sales