Multiple Choice
Quarterly figures for e-commerce retail sales were obtained from the first quarter of 2001 through the fourth quarter of 2007. A regression model was estimated to describe the trend in e-commerce retail sales over time. What does the plot of residuals versus predicted values suggest? 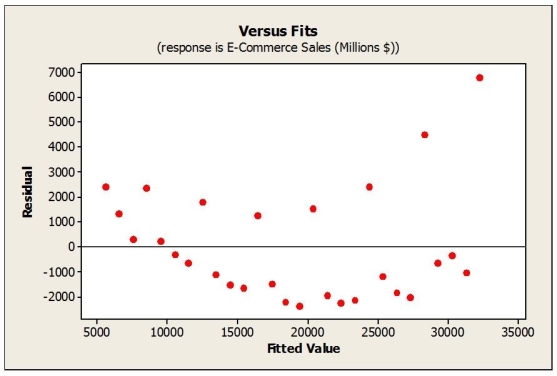
A) The data are not normal.
B) The linearity condition is not satisfied.
C) The equal spread condition is not satisfied.
D) The data are not normal, and the linearity condition is not satisfied.
E) The linearity condition is not satisfied, and the equal spread condition is not satisfied.
Correct Answer:

Verified
Correct Answer:
Verified
Q8: The advertising campaign for a high fibre
Q9: Data were collected for a sample of
Q10: The advertising campaign for a high fibre
Q11: Consider the following to answer the question(s)
Q12: Consider the following to answer the question(s)
Q14: Consider the following to answer the question(s)
Q15: Consider the following to answer the question(s)
Q16: Consider the following to answer the question(s)
Q17: A new movie is in the making
Q18: The best practice for modelling this data