Essay
The boxplots show monthly sales revenue figures ($ thousands) for a discount office supply company with locations in three different regions in Canada. (Atlantic, Central and West). 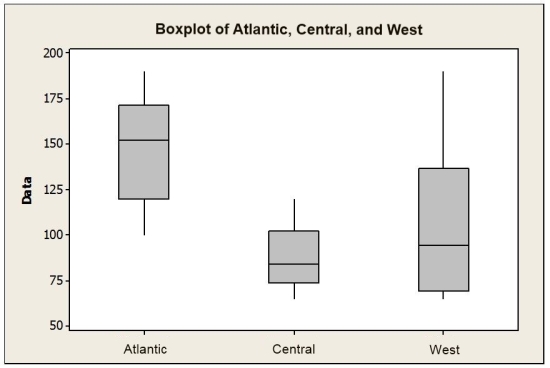 a. Which region has the highest median sales revenue?
b. Which region has the lowest median sales revenue?
c. Which region has the most variable sales revenue values? Explain.
Correct Answer:

Verified
a. Atlantic.
b. Cent...View Answer
Unlock this answer now
Get Access to more Verified Answers free of charge
Correct Answer:
Verified
b. Cent...
View Answer
Unlock this answer now
Get Access to more Verified Answers free of charge
Q1: Below is a histogram of salaries (in
Q1: Consider the following to answer the question(s)
Q2: Consider the following to answer the question(s)
Q3: Below is a time series graph for
Q4: Consider the following to answer the question(s)
Q7: The advantage of using the interquartile range
Q8: Below is the five-number summary of salaries
Q9: The asking price for homes on the
Q10: Below is the five-number summary of salaries
Q11: Below is the five number summary of