Essay
Below is a time series graph for monthly closing price of 3M Dental Products stock (beginning June 2005). 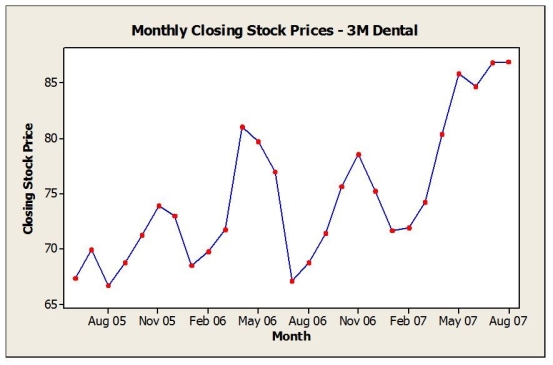 a. Are the closing prices for shares of 3M Dental Products from June 2005 through August 2007 stationary? Explain.
b. Would a histogram provide a good summary of these stock prices? Explain.
Correct Answer:

Verified
Correct Answer:
Verified
Q1: Below is a histogram of salaries (in
Q1: Consider the following to answer the question(s)
Q2: Consider the following to answer the question(s)
Q4: Consider the following to answer the question(s)
Q5: The boxplots show monthly sales revenue figures
Q7: The advantage of using the interquartile range
Q8: Below is the five-number summary of salaries
Q9: The asking price for homes on the
Q10: Below is the five-number summary of salaries
Q11: Below is the five number summary of