Multiple Choice
Figure 35-2
Use the pair of diagrams below to answer the following questions. 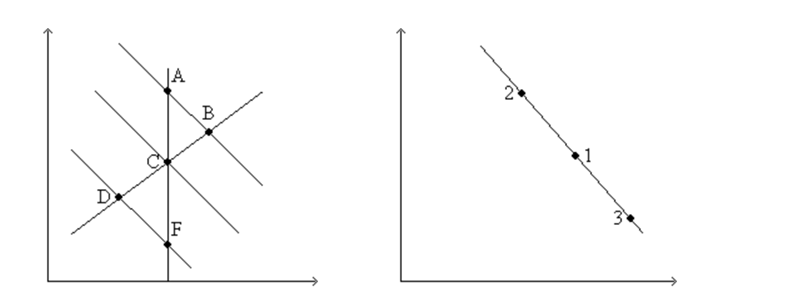
-Refer to Figure 35-2.If the economy starts at C and 1,then in the short run,an increase in taxes moves the economy to
A) B and 2.
B) D and 3.
C) E and 2.
D) None of the above is correct.
Correct Answer:

Verified
Correct Answer:
Verified
Q17: Figure 35-1.The left-hand graph shows a short-run
Q18: According to the Phillips curve,policymakers can reduce
Q19: If consumer confidence rises,then aggregate demand shifts<br>A)right,making
Q20: Economist A.W.Phillips found a negative correlation between<br>A)output
Q21: As the aggregate demand curve shifts leftward
Q23: If a central bank decreases the money
Q24: When aggregate demand shifts right along the
Q25: If consumer confidence falls,then aggregate demand shifts<br>A)right,raising
Q26: According to the Phillips curve,policymakers would reduce
Q214: Samuelson and Solow reasoned that when aggregate