Multiple Choice
Below are residual plots for this regression model. 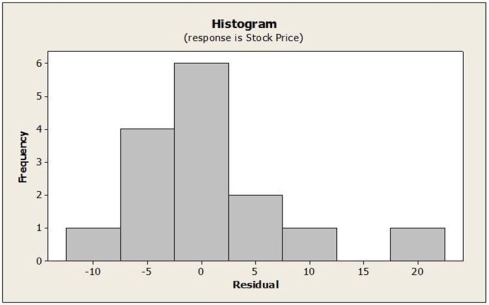

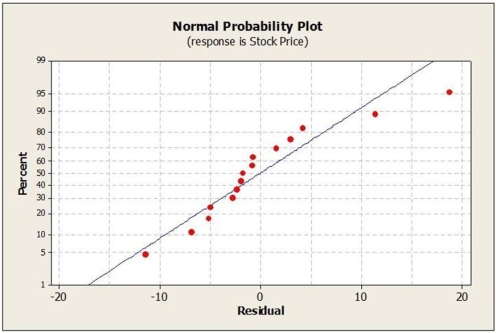 Based on these plots, which of the following statements is true?
A) The scatterplot of the residuals against the predicted values shows patter.
B) The scatterplot of residuals against the predicted values shows no possible outlier.
C) The histogram is bell-shaped. The Nearly Normal condition is reasonably satisfied.
D) The histogram indicates that the Independence assumption is violated.
E) The normal probability plot shows no bend.
Correct Answer:

Verified
Correct Answer:
Verified
Q1: Use the following to answer the question(s)
Q2: Which of the following is/are not correct
Q3: Use the following to answer the question(s)
Q5: Use the following to answer the question(s)
Q6: Use the following to answer the question(s)
Q7: Use the following to answer the question(s)
Q8: Re-expressing these data results in the following
Q9: Use the following to answer the question(s)
Q10: A forester would like to estimate the
Q11: Use the following to answer the question(s)