Multiple Choice
Use the following to answer the question(s) below.
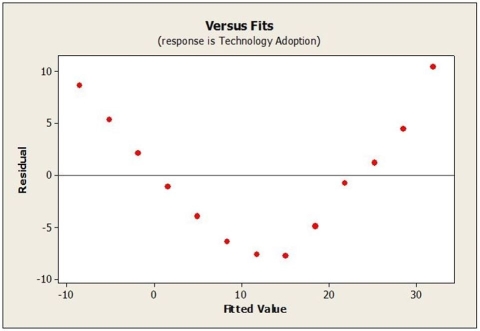
A linear regression model was fit to data representing technology adoption over time. The regression output and residual plot appears below. 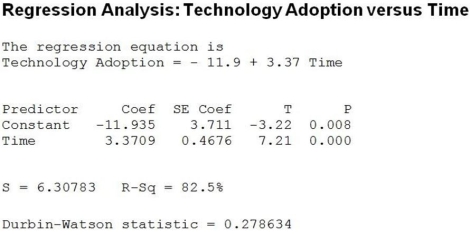
-Based on the output and plot, which of the following statements is not true?
A) According to the regression output, the model explains 82.5% of the variability in Technology Adoption. However, the residual plot shows a pattern and curvature.
B) The scatter plot of the residuals against the predicted values shows a pattern. A regression model applied to the data is questionable.
C) The t-test for the regression slope indicates that it is significantly different from zero, but the residual scatter plot shows that Equal Variance assumption is violated.
D) The regression model is applied to the time series data. The residual plot suggests that the Independence assumption might be violated. We have to use Durbin-Watson statistic to detect autocorrelation.
E) The plot shows that all assumptions and conditions for regression inference are met. R2 and P-value report that there is strong correlation between Technology Adoption and Time.
Correct Answer:

Verified
Correct Answer:
Verified
Q2: Which of the following is/are not correct
Q3: Use the following to answer the question(s)
Q4: Below are residual plots for this regression
Q5: Use the following to answer the question(s)
Q6: Use the following to answer the question(s)
Q8: Re-expressing these data results in the following
Q9: Use the following to answer the question(s)
Q10: A forester would like to estimate the
Q11: Use the following to answer the question(s)
Q12: Use the following to answer the question(s)