Essay
Annual estimates of the population in a certain city from 2004 (t = 1) onward are shown in the time series graph below. 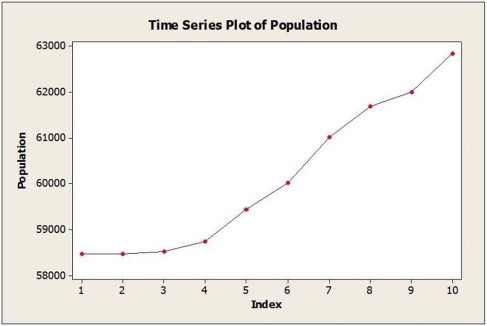 a. Identify the dominant time series component(s) in the data.
b. Below are the results from fitting a linear trend model to the data. Use this model to estimate the population in this city for 2014 (t = 11).
Fitted Trend Equation  , = 57,206 + 528t
c. Below are the results from fitting a quadratic trend model to the data. Use this model to estimate the population in this city for 2014 (t = 11).
Fitted Trend Equation  , = 58,159 + 52t + 43.3t2
d. The actual population estimate for 2014 is 63,828. Which model does better? Why?
Correct Answer:

Verified
a. Trend component
b. 63,014
c...View Answer
Unlock this answer now
Get Access to more Verified Answers free of charge
Correct Answer:
Verified
b. 63,014
c...
View Answer
Unlock this answer now
Get Access to more Verified Answers free of charge
Q3: Daily closing stock prices for Kyopera Corporation
Q4: Consider the following to answer the question(s)
Q5: Consider the following to answer the question(s)
Q6: A company has recorded annual sales (in
Q7: Annual estimates of the population in the
Q9: Consider the following to answer the question(s)
Q10: Consider the following to answer the question(s)
Q11: Monthly closing stock prices, adjusted for dividends,
Q12: Consider the following to answer the question(s)
Q13: The MSE for the forecasting method used