Essay
Monthly closing stock prices, adjusted for dividends, were obtained for Boeing Corporation from January 2006 through August 2008 (closing price on the first trading day of the month). The time series graph of these data is shown below. 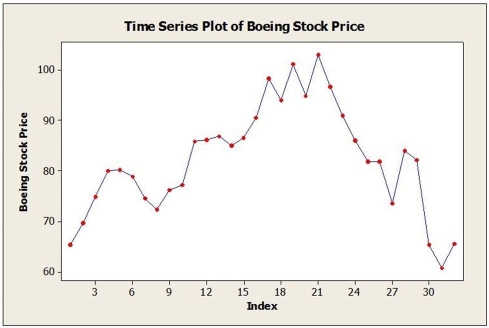 a. Below are the results of fitting a third-order autoregressive model, AR (3). Write out the model. Are the second and third lagged values significant? Explain.
Final Estimates of Parameters
Type Coef SE Coef T P
Lag 1 0.9247 0.1898 4.87 0.000
Lag 2 0.0429 0.2603 0.16 0.870
Lag 3 -0.0764 0.1959 -0.39 0.699
Constant 8.362 1.223 6.84 0.000
b. Below are the results of fitting a first-order autoregressive model, AR (1). Write out the model. Is this model typical for stock price data? Explain.
Final Estimates of Parameters
Type Coef SE Coef T P
Lag 1 0.9098 0.0969 9.39 0.000
Constant 6.835 1.207 5.67 0.000
Correct Answer:

Verified
Let Boeing stock price be dependent vari...View Answer
Unlock this answer now
Get Access to more Verified Answers free of charge
Correct Answer:
Verified
View Answer
Unlock this answer now
Get Access to more Verified Answers free of charge
Q6: A company has recorded annual sales (in
Q7: Annual estimates of the population in the
Q8: Annual estimates of the population in a
Q9: Consider the following to answer the question(s)
Q10: Consider the following to answer the question(s)
Q12: Consider the following to answer the question(s)
Q13: The MSE for the forecasting method used
Q14: A large automobile parts supplier keeps track
Q15: Quarterly sales data (in $10,000) for a
Q16: Consider the following to answer the question(s)