Essay
Quarterly sales figures for e-commerce retail sales were obtained from the first quarter of 2009 through the fourth quarter of 2015. A regression model was estimated to describe the trend in e-commerce retail sales over time.
a. Based on the plot of residuals versus predicted values, is the linear model appropriate? Explain. 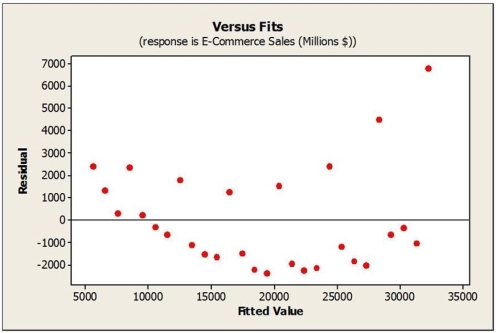 b. The Durbin-Watson statistic for this regression model was found to be 1.727. What can you conclude from this statistic at the 0.01 level of significance?
Correct Answer:

Verified
a. The residual plot shows a curvature. ...View Answer
Unlock this answer now
Get Access to more Verified Answers free of charge
Correct Answer:
Verified
View Answer
Unlock this answer now
Get Access to more Verified Answers free of charge
Q18: Consider the following to answer the question(s)
Q19: Quarterly figures for e-commerce retail sales were
Q20: Data were collected for a sample of
Q21: A food company launches an advertising campaign
Q22: Consider the following to answer the question(s)
Q23: Consider the following to answer the question(s)
Q24: After transforming data, a model of retail
Q26: Consider the following to answer the question(s)
Q27: Consider the following to answer the question(s)
Q28: Consider the following to answer the question(s)