Multiple Choice
Quarterly figures for e-commerce retail sales were obtained from the first quarter of 2009 through the fourth quarter of 2015. A regression model was estimated to describe the trend in e-commerce retail sales over time. What does the plot of residuals versus predicted values suggest? 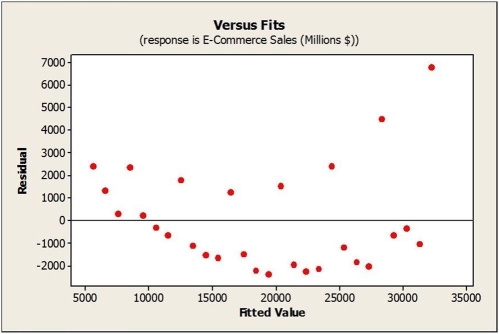
A) The relationship seems reasonably straight.
B) There is no reason to be alert for autocorrelation.
C) The Equal Spread condition is satisfied.
D) The Linearity condition is satisfied.
E) The Linearity condition is not satisfied, and the Equal Spread condition is not satisfied as well.
Correct Answer:

Verified
Correct Answer:
Verified
Q14: Consider the following to answer the question(s)
Q15: Suppose that data on labour productivity and
Q16: Quarterly figures for e-commerce retail sales were
Q17: Consider the following to answer the question(s)
Q18: Consider the following to answer the question(s)
Q20: Data were collected for a sample of
Q21: A food company launches an advertising campaign
Q22: Consider the following to answer the question(s)
Q23: Consider the following to answer the question(s)
Q24: After transforming data, a model of retail