Multiple Choice
Consider the following to answer the question(s) below:
Monthly closing stock prices for a utility company were obtained from January 2014 through August 2015. A regression model was estimated to describe the trend in closing stock prices over time. 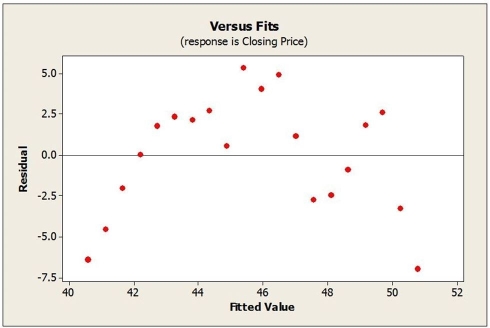
-What does the plot of residuals above suggest?
A) An outlier is present in the data set.
B) The Linearity condition is not satisfied.
C) A high-leverage point is present in the data set.
D) Extrapolation was used.
E) There is no pattern. The relationship seems reasonably straight.
Correct Answer:

Verified
Correct Answer:
Verified
Q9: Data on Internet usage (per 100 inhabitants)
Q10: Consider the following to answer the question(s)
Q11: Consider the following to answer the question(s)
Q12: Consider the following to answer the question(s)
Q13: Monthly closing stock prices for a utility
Q15: Suppose that data on labour productivity and
Q16: Quarterly figures for e-commerce retail sales were
Q17: Consider the following to answer the question(s)
Q18: Consider the following to answer the question(s)
Q19: Quarterly figures for e-commerce retail sales were