Multiple Choice
The figures show a contour graph for a function f in blue with a constraint function  in black. Locate any optimal points of
  and classify each as a relative maximum point or a relative minimum point.
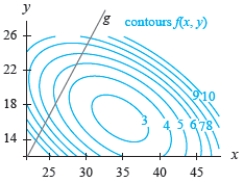
A) (31, 10, 4)
B) (32, 14, 2)
C) (35, 16, 2)
D) (32, 16, 2)
E) (35, 18, 2)
Correct Answer:

Verified
Correct Answer:
Verified
Q20: A company has the Cobb-Douglas production function
Q21: Consider the following contour graph and three-dimensional
Q22: A fitness center is trying to determine
Q23: Express SSE as a multivariable function of
Q24: The daily output at a plant manufacturing
Q26: Test for relative maxima and minima. <img
Q27: A restaurant mixes ground beef that costs
Q28: Express SSE as a multivariable function of
Q29: For a region, the percentage of adults
Q30: A process to extract pigment from sunflower