Multiple Choice
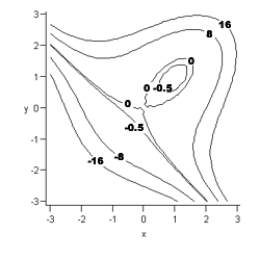
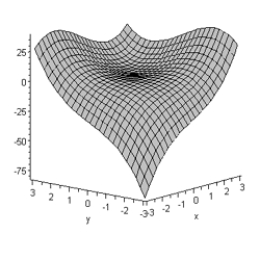
Consider the following contour graph and three-dimensional graph for a function F with inputs x and y. On the basis of the graphs approximate the inputs and output of each critical point in the form 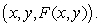
A) relative maximum: none
Relative minimum: (1,1,-5)
Saddle point: (0,0,0)
B) relative maximum: none
Relative minimum: (1,1,-1)
Saddle point: (0,0,0)
C) relative maximum: none
Relative minimum: (1,1,-1)
Saddle point: (0,0,-1)
D) relative maximum: (1,1,-1)
Relative minimum: (-3,-3,-75)
Saddle point: (0,0,-1)
E) relative maximum: (0,0,0)
Relative minimum: (1,1,-1)
Saddle point: none
Correct Answer:

Verified
Correct Answer:
Verified
Q16: Consider the table showing the numbers of
Q17: Let <img src="https://d2lvgg3v3hfg70.cloudfront.net/TB6775/.jpg" alt="Let be
Q18: Locate the optimal point of the constrained
Q19: A process to extract pigment from sunflower
Q20: A company has the Cobb-Douglas production function
Q22: A fitness center is trying to determine
Q23: Express SSE as a multivariable function of
Q24: The daily output at a plant manufacturing
Q25: The figures show a contour graph for
Q26: Test for relative maxima and minima. <img