Multiple Choice
The table below gives the number of inches of precipitation that fell in a city in the given months. Use the method of least squares to find the multivariable function f with inputs a and b for the best fitting line  where x is 1 in January, 2 in February, and 3 in March.
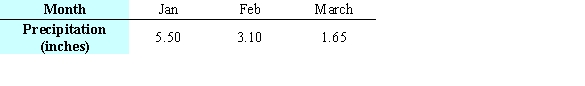
A) 
B) 
C) 
D) 
E) 
Correct Answer:

Verified
Correct Answer:
Verified
Q35: A model for the elevation above sea
Q36: A nursery sells mulch by the truckload.
Q37: A rancher removed 200 feet of wire
Q38: Is the point <img src="https://d2lvgg3v3hfg70.cloudfront.net/TB6775/.jpg" alt="Is the
Q39: Test for relative maxima and minima. <img
Q41: For a region, the percentage of adults
Q42: The table shows the number of days
Q43: Write the Lagrange system of partial derivative
Q44: Fatty acids are liberated from a fat
Q45: Let <img src="https://d2lvgg3v3hfg70.cloudfront.net/TB6775/.jpg" alt="Let be